OverviewQtilities provides a debugging plugin which can help you to debug your applications. The debug plugin provides many different views and ideas to help you debug your applications at runtime. The idea is not to replace your standard C++ debugger, but rather to give you runtime information about your application's state as well as specific information about any QObject in your application. This page will give an overview of the debugging plugin and highlight some of its more usefull features. Table of contents: |
|
The debugging plugin is part of the Testing module and can be added manually to your application, or if your application uses the Qtilities extension system it can be added automatically as an application mode when you load DebugPlugin. You can find the documentation for the plugin here: Qtilities::Plugins::Debug::DebugPlugin.
To access the debug widget manually, do the following:
Another way to use the debug widget is to make your application extendable and then to add the debug plugin library to your application's plugin path. It will automatically be loaded as a mode in your application, thus you also need to use the Qtilities::CoreGui::QtilitiesMainWindow and set it up to use modes:
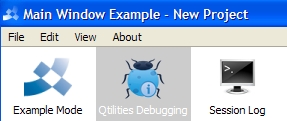
Now you are ready to go. The image below shows the added mode in your application:
Both the MainWindowExample and the ObjectManagement examples in the QtilitiesExamples project make use of the debug plugin and can be used as a reference if you have trouble getting it to work.
Before going on, lets start with an image of how the debug mode looks. The image below shows the mode with the "Global Object Pool" tab selected in the MainWindowExample example.
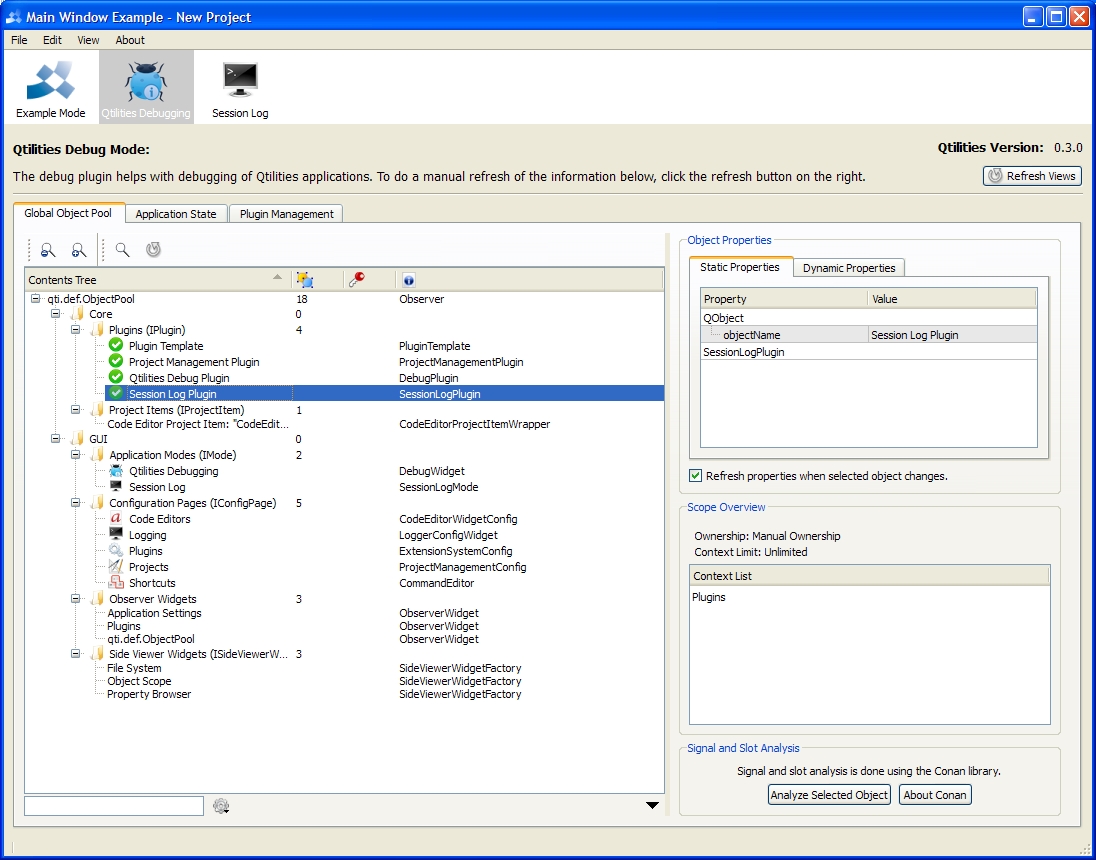
The "Global Object Pool" tab presents you with a list of all objects in your global object pool on the left and information about the selected object on the right. Qtilities automatically adds several objects to the global object pool as you can see in the above image. In code you can add any QObject to the pool like this:
Once you object is in the pool you can select it and get the following information about it:
An overview of the static properties on your object. The static properties are those added to your object using the Q_PROPERTY macro in your class definition. You can use the property editor widget to edit these properties and it is nicely displayed for each class that your object inherits.
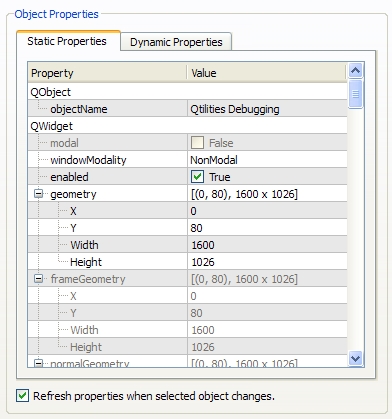
Note that Qtilities must be build with the QTILITIES_PROPERTY_BROWSER define for the properties to be show.
An overview of the dynamic properties on your object. The dynamic properties are those added to your object using the QObject::setProperty() function. Since Qtilities uses dynamic properties extensively on objects it manage the objects in the example application already have some dynamic properties as shown below.
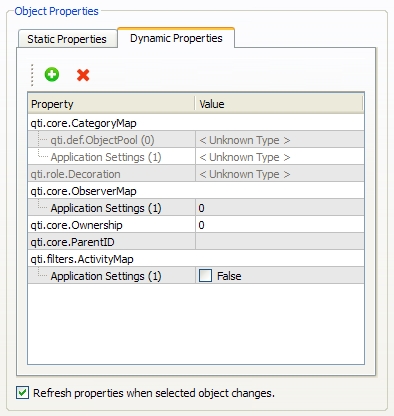
It is also possible to add, edit and remove dynamic properties on your objects.
Note that Qtilities must be build with the QTILITIES_PROPERTY_BROWSER define for the properties to be show.
The "Object Scope" view shows the scopes in which your object is visible. The Subject-Observer pattern implementation in Qtilities allows objects to be attached to (observed by) multiple contexts. This view shows the contexts in which your object is observed.
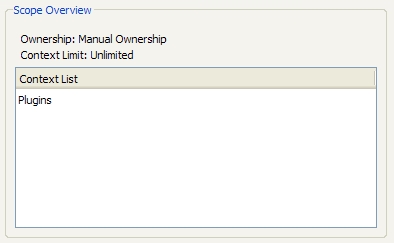
If this does not really make sense, perhapts see the Observers article for an introduction on the topic.
Perhaps one of the most usefull features on this page is the ability to analyze signals and slots on your object. This is done through integration with Conan for Qt. Since there is a detailed description on the project page of the Conan libary we will not go into all of its features here.
In a nutshell, it allows you to analyze signal and slots connections, signal emissions and it even lets you search for duplicate connections in your application.
Below is an example where we can see the analysis for the Plugins configuration page in the example.
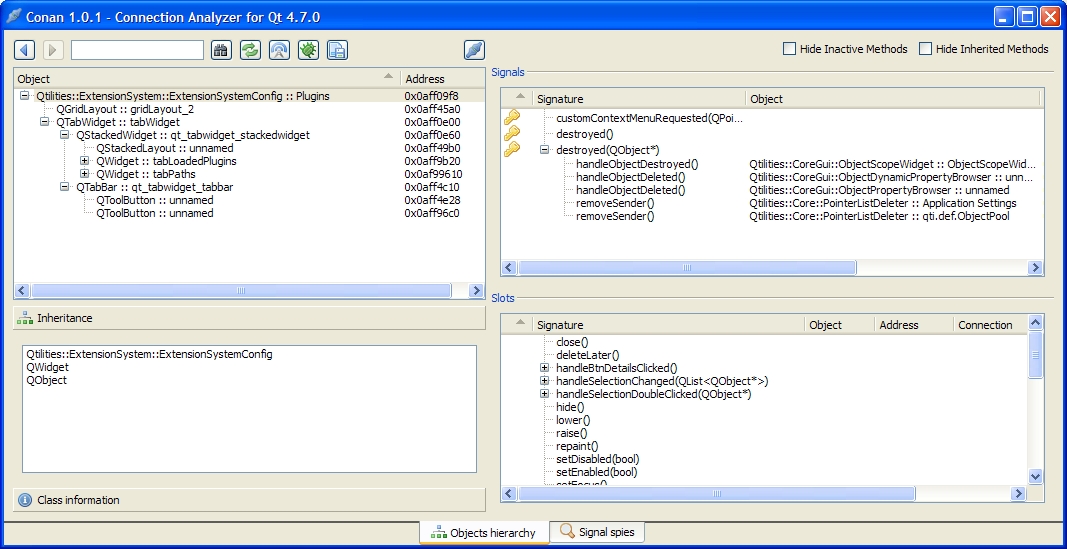
We can see that the object's destroyed(QObject*) signal is connected to a few slots where views will update themselves if the object is removed, and also to the two observers to which it was attached.
It is also possible to spy specific signals which will log all emissions of that signal.
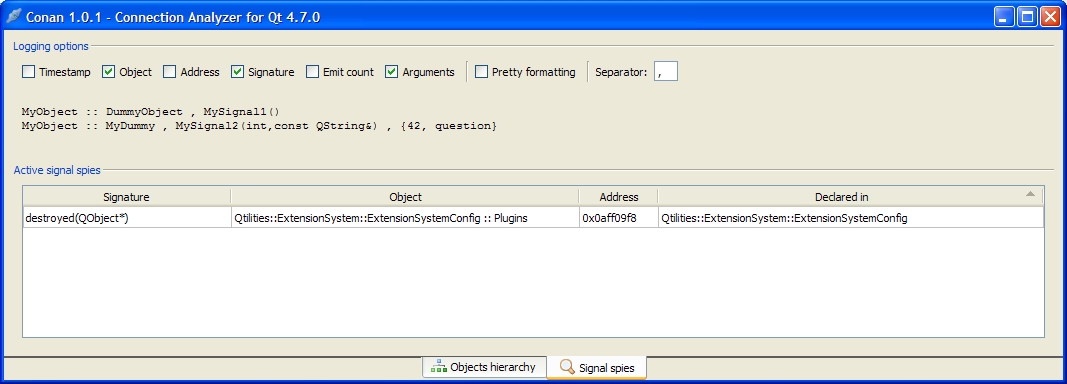
When the destroyed(QObject*) signal is emitted a notification will be printed in your application's output:
Note that Qtilities must be build with the QTILITIES_CONAN define for the analysis to work. If you built it with this define, the buttons will just be grayed out. Also note that Conan supports very specific versions of Qt, thus see the project's page to make sure your version is supported.
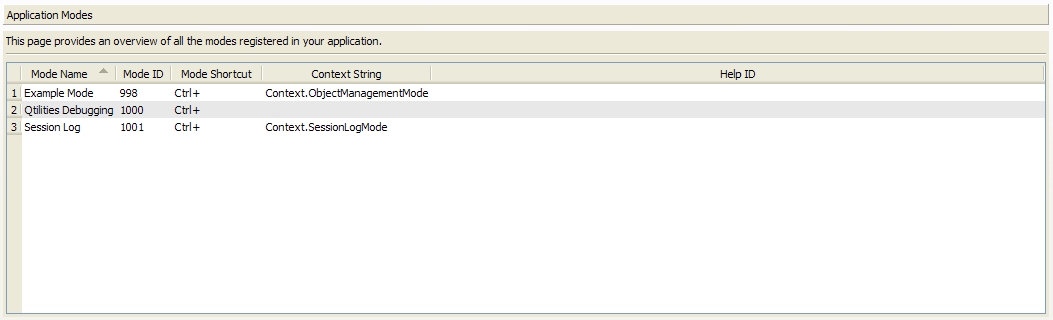
The "Application State" tab gives information about the state of your application.
The application modes view gives an overview of all the modes added to your application.
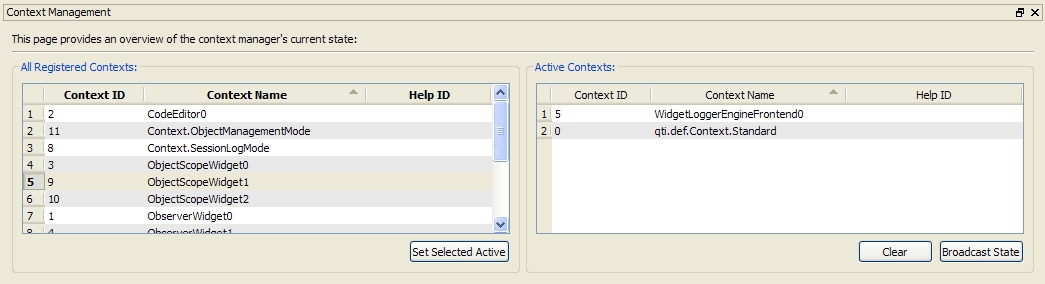
The context management view gives an overview of all the contexts registered in your application. It is possible to modify the active contexts in your application through this view which can be extremely usefull when debugging your own context specific items. The view is a dockable widget which can be undocked to allow you to undock it and observe other parts of the application when you manually change the active contexts.
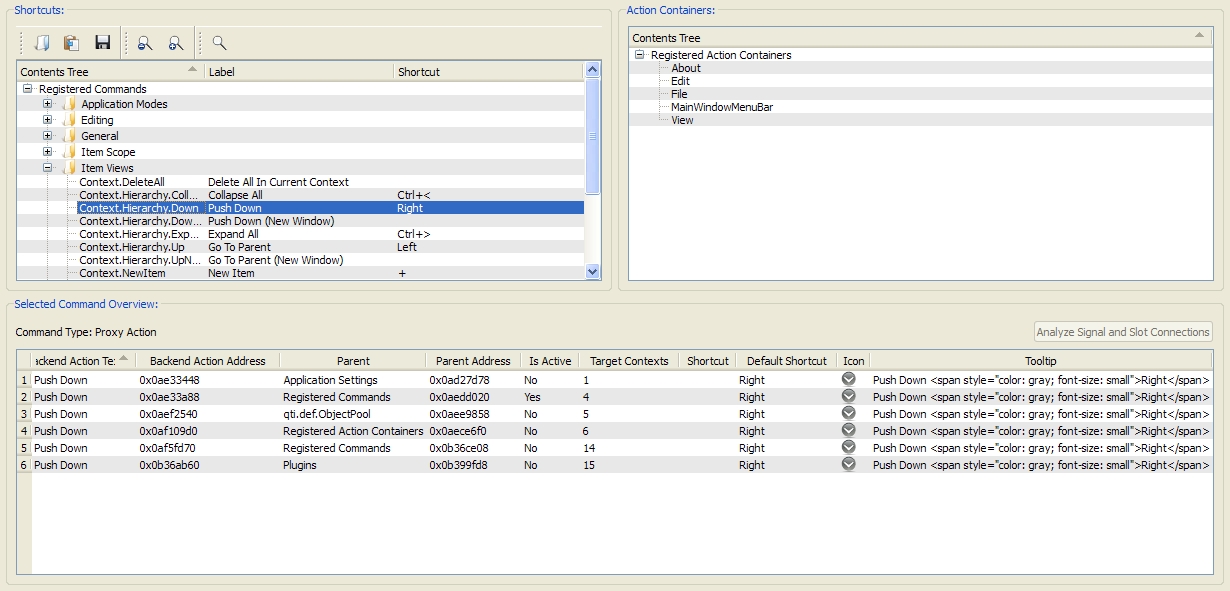
The action management view gives an overview of all the actions and shortcuts registered in the Action Manager. You can select an action or shortcut and an overview of the action will be given. If the action is a Qtilities::CoreGui::ProxyAction the overview will provide details of the backend actions registered for the frontend (proxy) action as shown below.
It is also possible to analyze and verify signal and slot connections between the frontend action and the active backend actions in this view. Again, this uses the Conan integration described in Signal and Slot Analysis.
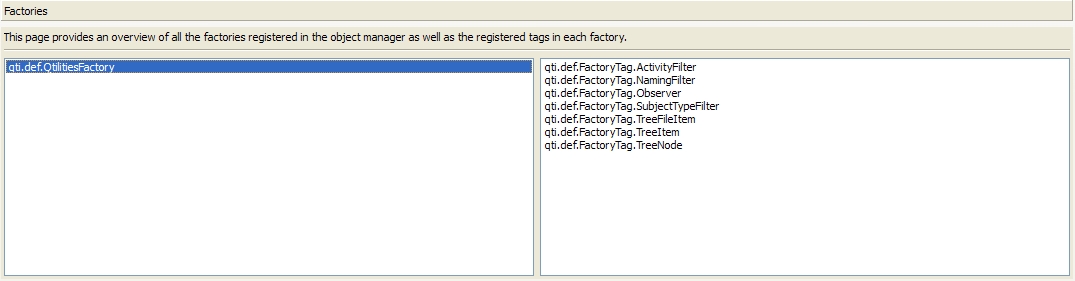
The factories view gives an overview of all the factories registered in the Object Manager and the available tags registered in each factory.
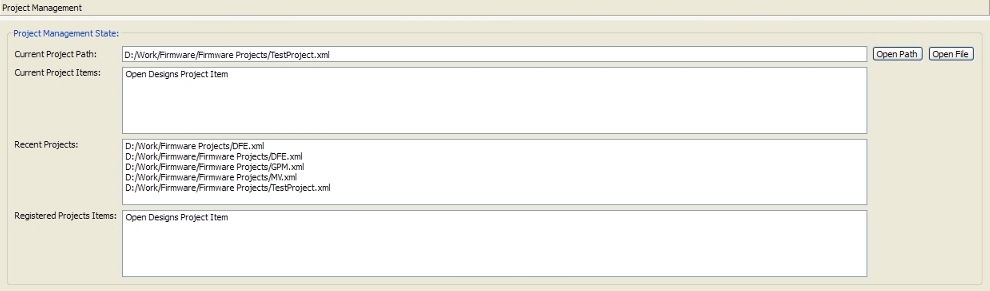
If you use projects in your application, the project management view will provide you with details about the Project Manager's current state. It is possible to open the current project or it's path and to get an overview of project items registered in both the active project and the Project Manager. Lastly, a list of recent projects is also provided.
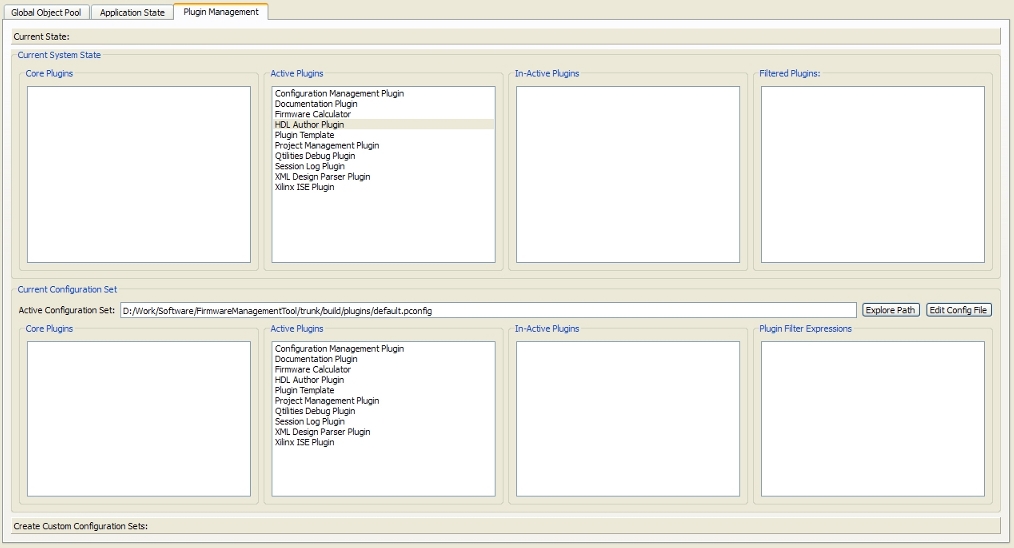
The "Plugin Management" tab provides plugin management and overview views.
The currents state view shows the current state of the extension system in terms of the currently loaded plugins and the active plugin configuration set.
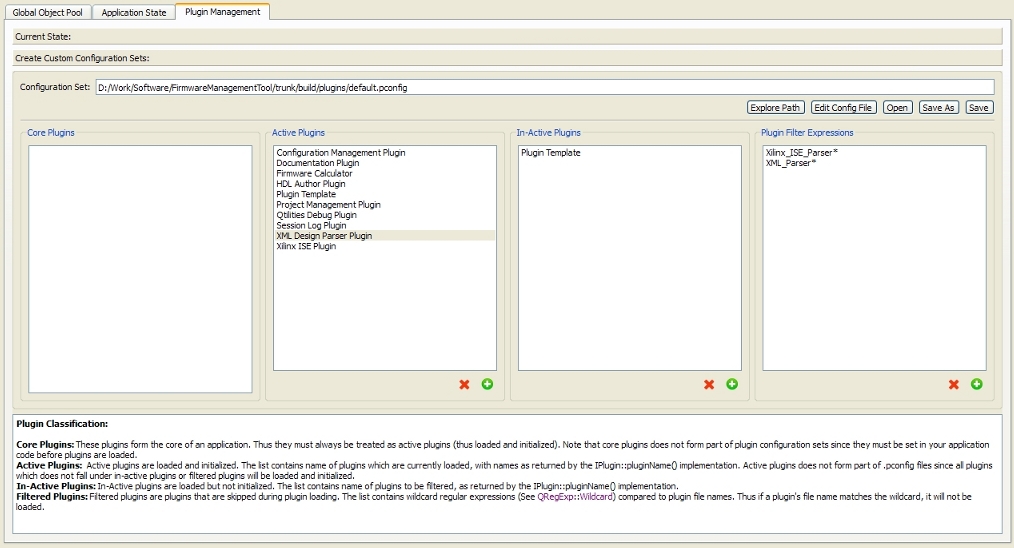
A very usefull feature of the plugin management tab is the ability to create custom plugin configuration sets easily. It provides an easy to use interface for dragging and dropping plugins to change their classification and it does integrity checks in the background. For example, you cannot make a core plugin part of your In-Active Plugins list. It will also automatically create a filter expression for existing plugin's file names when you make them part of the Plugin Filter Expressions list. You can add and remove new plugins and an overview of the different plugin classifications are given.
If you use this view to create your custom configuration sets, you don't have to worry about the file format used by the extension system and you can edit and save old sets easily.
To make debugging easier all Qtilities::CoreGui::ObserverWidget widgets will automatically add a new "Debug Selected Object" action to their action toolbars (when build in debug mode) as shown below:
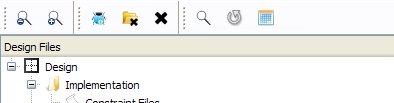
This action (blue bug) will add the selected object to your global object pool and then switch to the debugging plugin (if using the approach described in Showing the debug widget using the Debug Plugin, otherwise the object will just be added to the global object pool).
| Qtilities : Reference Documentation | Back to top |
Copyright © 2009-2013, Jaco Naudé
|

